Curating the perfect dataset to answer marketing questions doesn't have to be complicated. In this post, I'll let you in on the techniques I used to create my Super Bowl Ad dataset.
The Big Game
Making it to the Super Bowl is the dream of many athletes, but it’s also a coveted night for marketing professionals. Every year, brands line up to fork over millions of dollars for a chance to have a 30-second ad spot during the event, which an estimated 127.7 million viewers tuned in for in 2025. Advertisers aim to capitalize on the large audience, and Super Bowl ads have become a part of the Big Game experience. Many people even watch just to enjoy the ads, polling shows. But is the price of the ad spot, production, and extravagant celebrity endorsements actually worth it for the companies?
Data Science Question
To answer this broad question, I narrowed it down to something specific, measurable, and feasible for me to collect data on. All good data science starts with a good question. Given the recency of the 2025 Super Bowl, I chose to use data from the 2024 Super Bowl, where the dust has already settled. I thought about the data I had access to, and what it could tell me. My question of interest became:
How did Super Bowl 2024 ads affect short-term brand reach and influence?
Using data from YouTube, Google, Wikipedia, marketing reports, and my own observations, I set out to answer this question.
The Ethics of Data Collection
Data is power. That’s why it’s important to be ethical about the way we collect it, especially through web scraping. Before webscraping, it’s important to check out the robots.txt page on the site of interest. Because I was going to scrape from Wikipedia, I used their robots.txt page to make sure I was allowed to do so. Here is what that looks like:
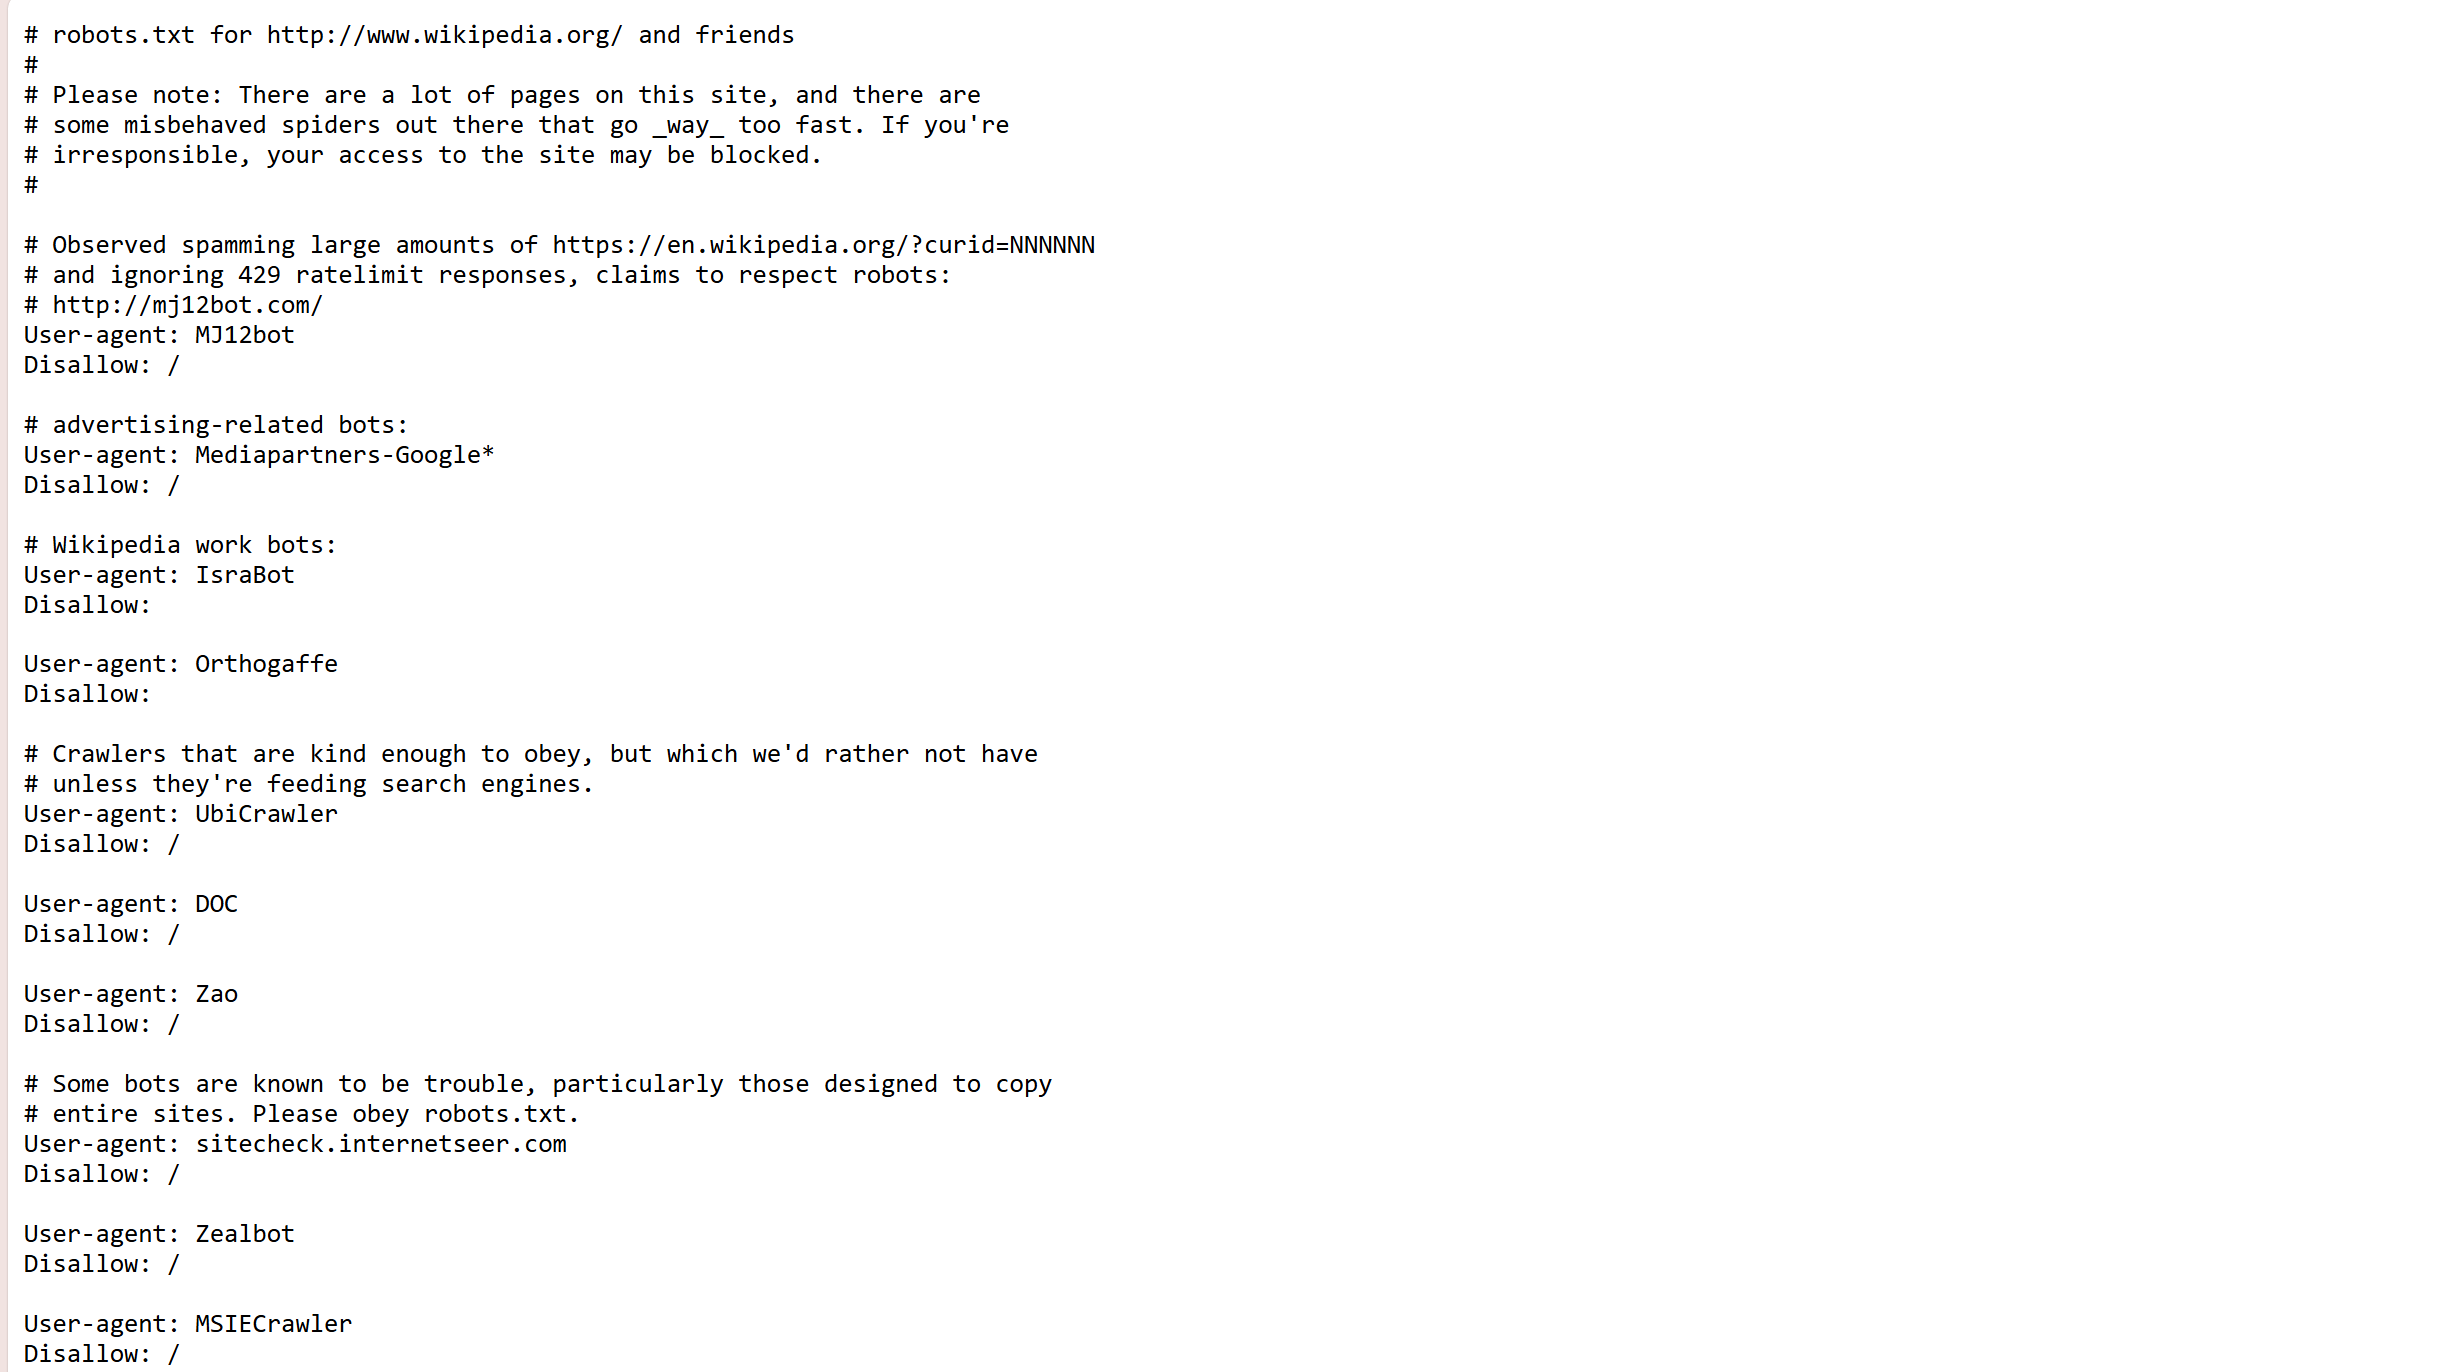
This is just the first few entries, but as you can read, Wikipedia has a pretty tolerant policy for web scraping. They have listed a few specific bots that they want to disallow for bad behavior, but a small project like mine was aligned with their policies.
I also used YouTube’s API to gather information about the view and like counts for the 2024 Super Bowl ads. As with most well-documented APIs, YouTube has clear policies for the use of their data. The data I gathered was aggregated data, rather than user-specific information about who watched the videos. APIs are a great way to ensure the ethical use of data.
I planned to use some polling data from YouGov, but I wanted to make sure it was allowed by their policies. These policies state “You may: Use, share, and adapt the Licensed Data for non-commercial purposes (e.g. academic research, journalism, critique, personal blogs, and newsletters).” So I knew it was ethical for me to move forward.
Web Scraping (Wikipedia)
First, I wanted a list of all the ads from the 2024 Super Bowl, along with descriptions of them and other general information. To get this list, I chose to scrape a table from this Wikipedia page.
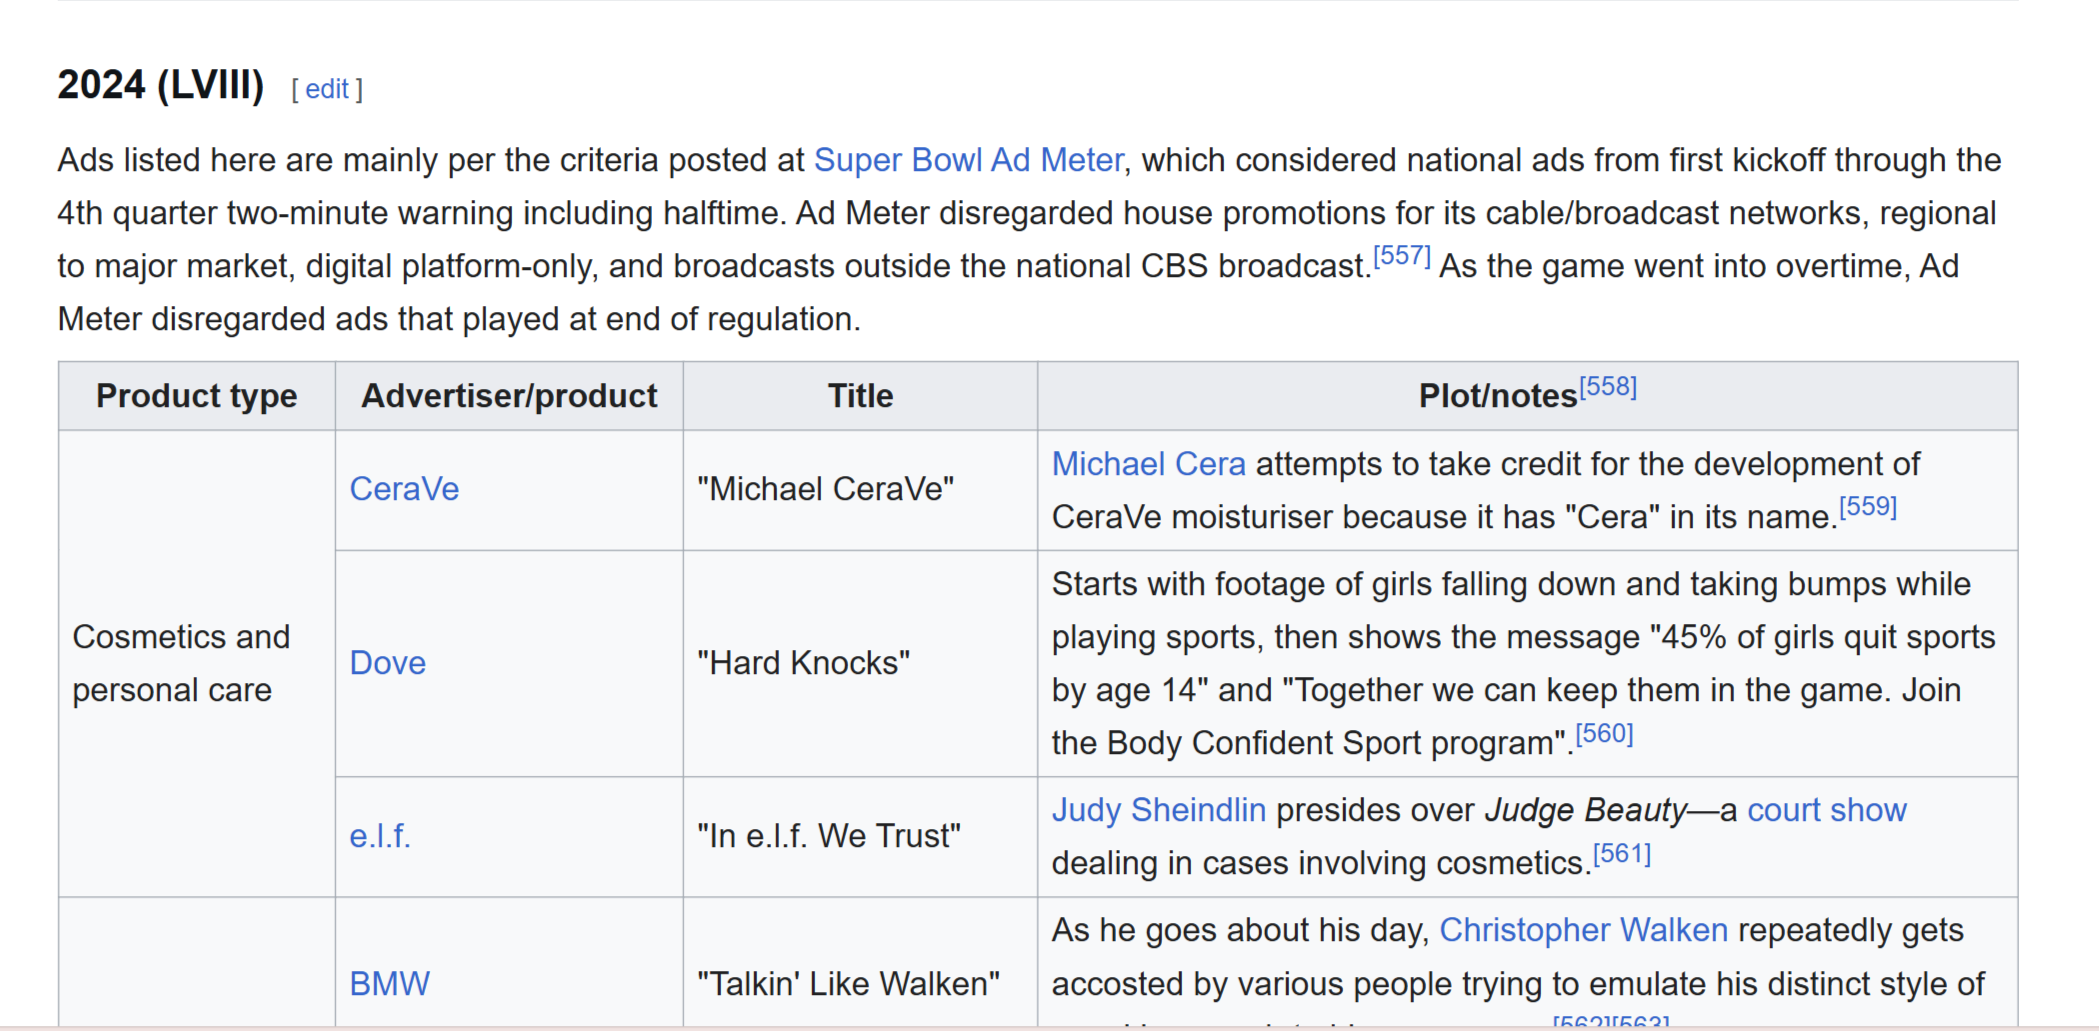
Wikipedia articles often have a variety of tables that are pretty simple to web scrape. My Python code for scraping this particular table can be found in the GitHub repo for this project, which I’ll be linking at the end of this post.
Because this Wikipedia table had sub-categories for each type of product being advertised, I had to adjust my code a few times to make sure I included those correctly in my dataframe. I also had to manually correct a few lines of my data. Web scraping is rarely perfect, because the source HTML is rarely perfect, but it’s a very useful tool for quick data collection.
APIs (YouTube)
APIs or Application Programming Interfaces are a set of protocols that allow applications to communicate with each other. In my case, I wanted to communicate with YouTube’s API to download data for many videos in a quick and effective way. YouTube has a very extensive and well documented API, which you can find linked here. I created my own developer portal and generated an API key, which allowed me to access the API.
In order to get the data I wanted, I went to YouTube and gathered the video IDs of the videos I was interested in. I then used Python to loop through the video IDs, making requests to the API and gathering the stats I was interested in. That code can be found in the project repo.
The main challenge with this method is just making sure to understand the different endpoints of the API you want to use. An endpoint is a URL that corresponds to a function or resource within an API. Every API’s endpoints are different, and each require different parameters. A really helpful video for understanding YouTube’s API can be found here One thing I had to adjust for was that YouTube only allows 50 video IDs at a time to be requested, so I had to break my videos into two chunks. However, once I understood YouTube’s videos endpoint, getting the data I needed was simple.
Google Trends
One of my favorite data sources for this project was Google Trends. Using data that Google has made publicly available here, you can see the evolution of any search term’s popularity over time. You enter a date range of interest along with a search term of interest, and Google will display its relative popularity over that time period.
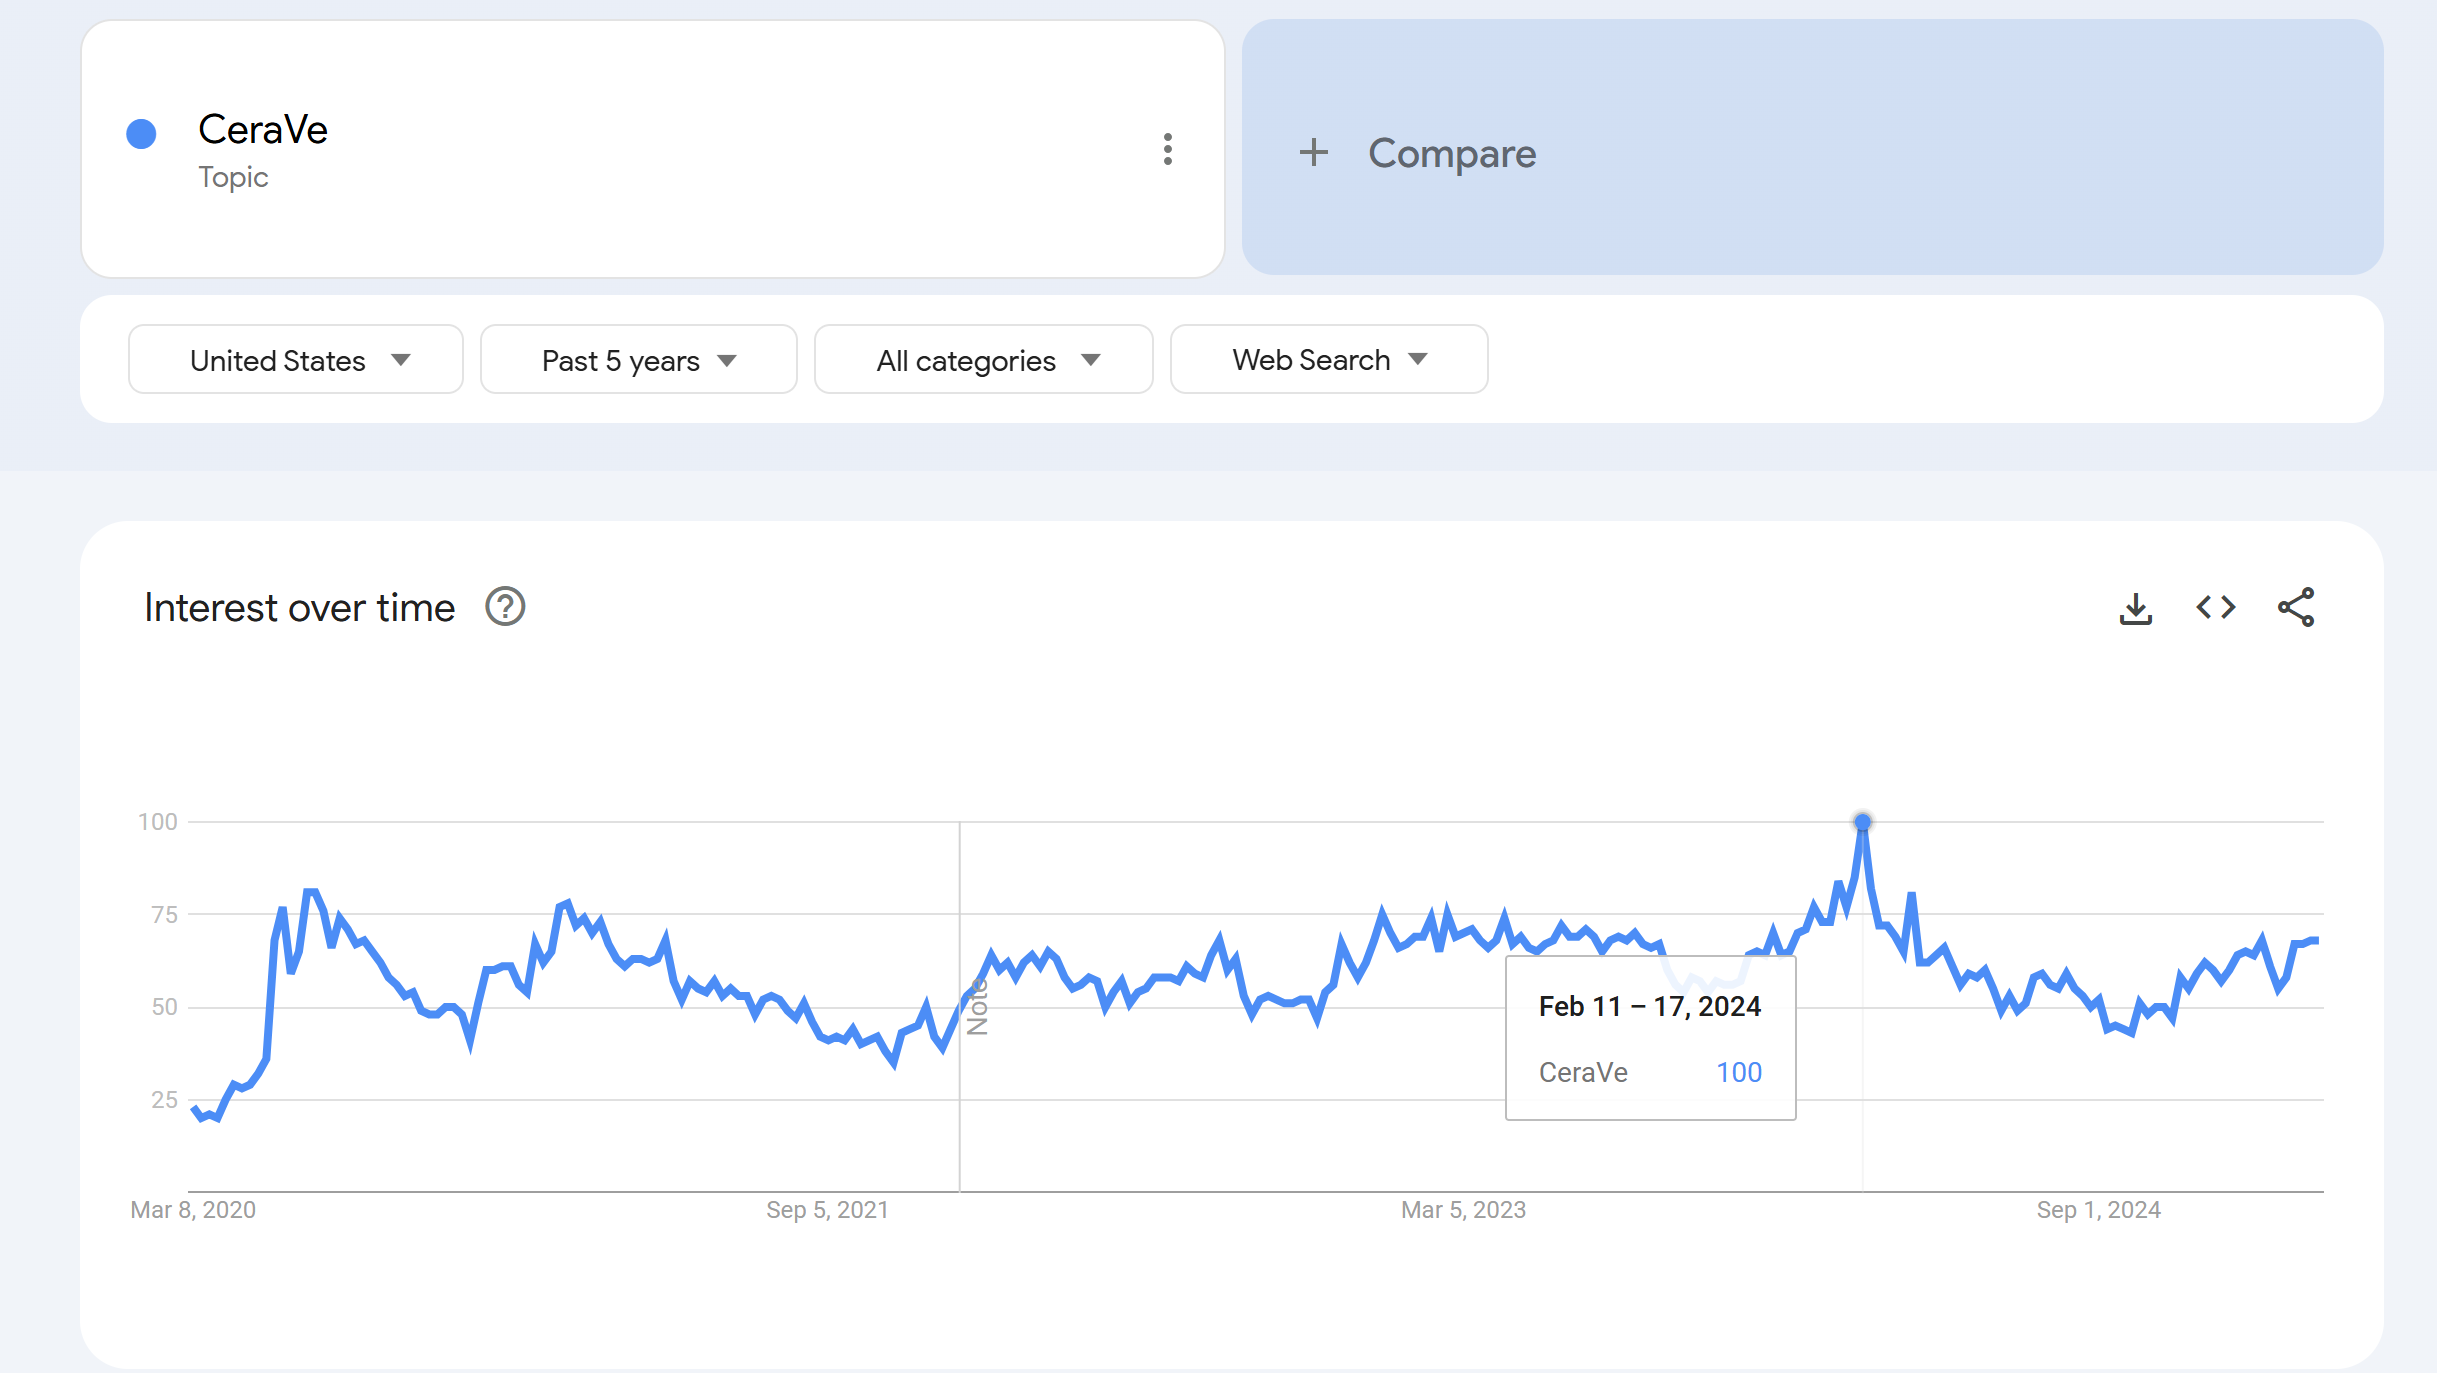
For example, CeraVe’s score of 100 on February 11th, 2024, shows me that interest in that search term had a five year peak on the week that CeraVe’s ad featuring Michael Cera aired during the Super Bowl.
This data can be easily downloaded in CSV format. I downloaded the reports for each of the brands, then used Python to loop through the CSVs, gathering the relative search popularity measurement for February 11th, 2024, as well as creating a binary variable simply indicating whether or not the brand had its peak search popularity on that week.
Other Data
I also gathered data from a few other sources to create a more well-rounded project. YouGov and The Harris Poll both released polling data on how audiences responded to Super Bowl 2024 ads in marketing terms. They studied whether brands that advertised during the event increased their familiarity, or likelihood of being purchased, for example. These reports came in PDF format, and while there are packages that allow you to scrape PDFs in Python, the tables weren’t formatted in an easily scrapeable way, so I ended up manually copying the data into my dataset.
Additionally, I was interested in what effect celebrity endorsements had on the success of an ad, so I created my own variable by observing whether or not each ad featured celebrities.
Final Dataset
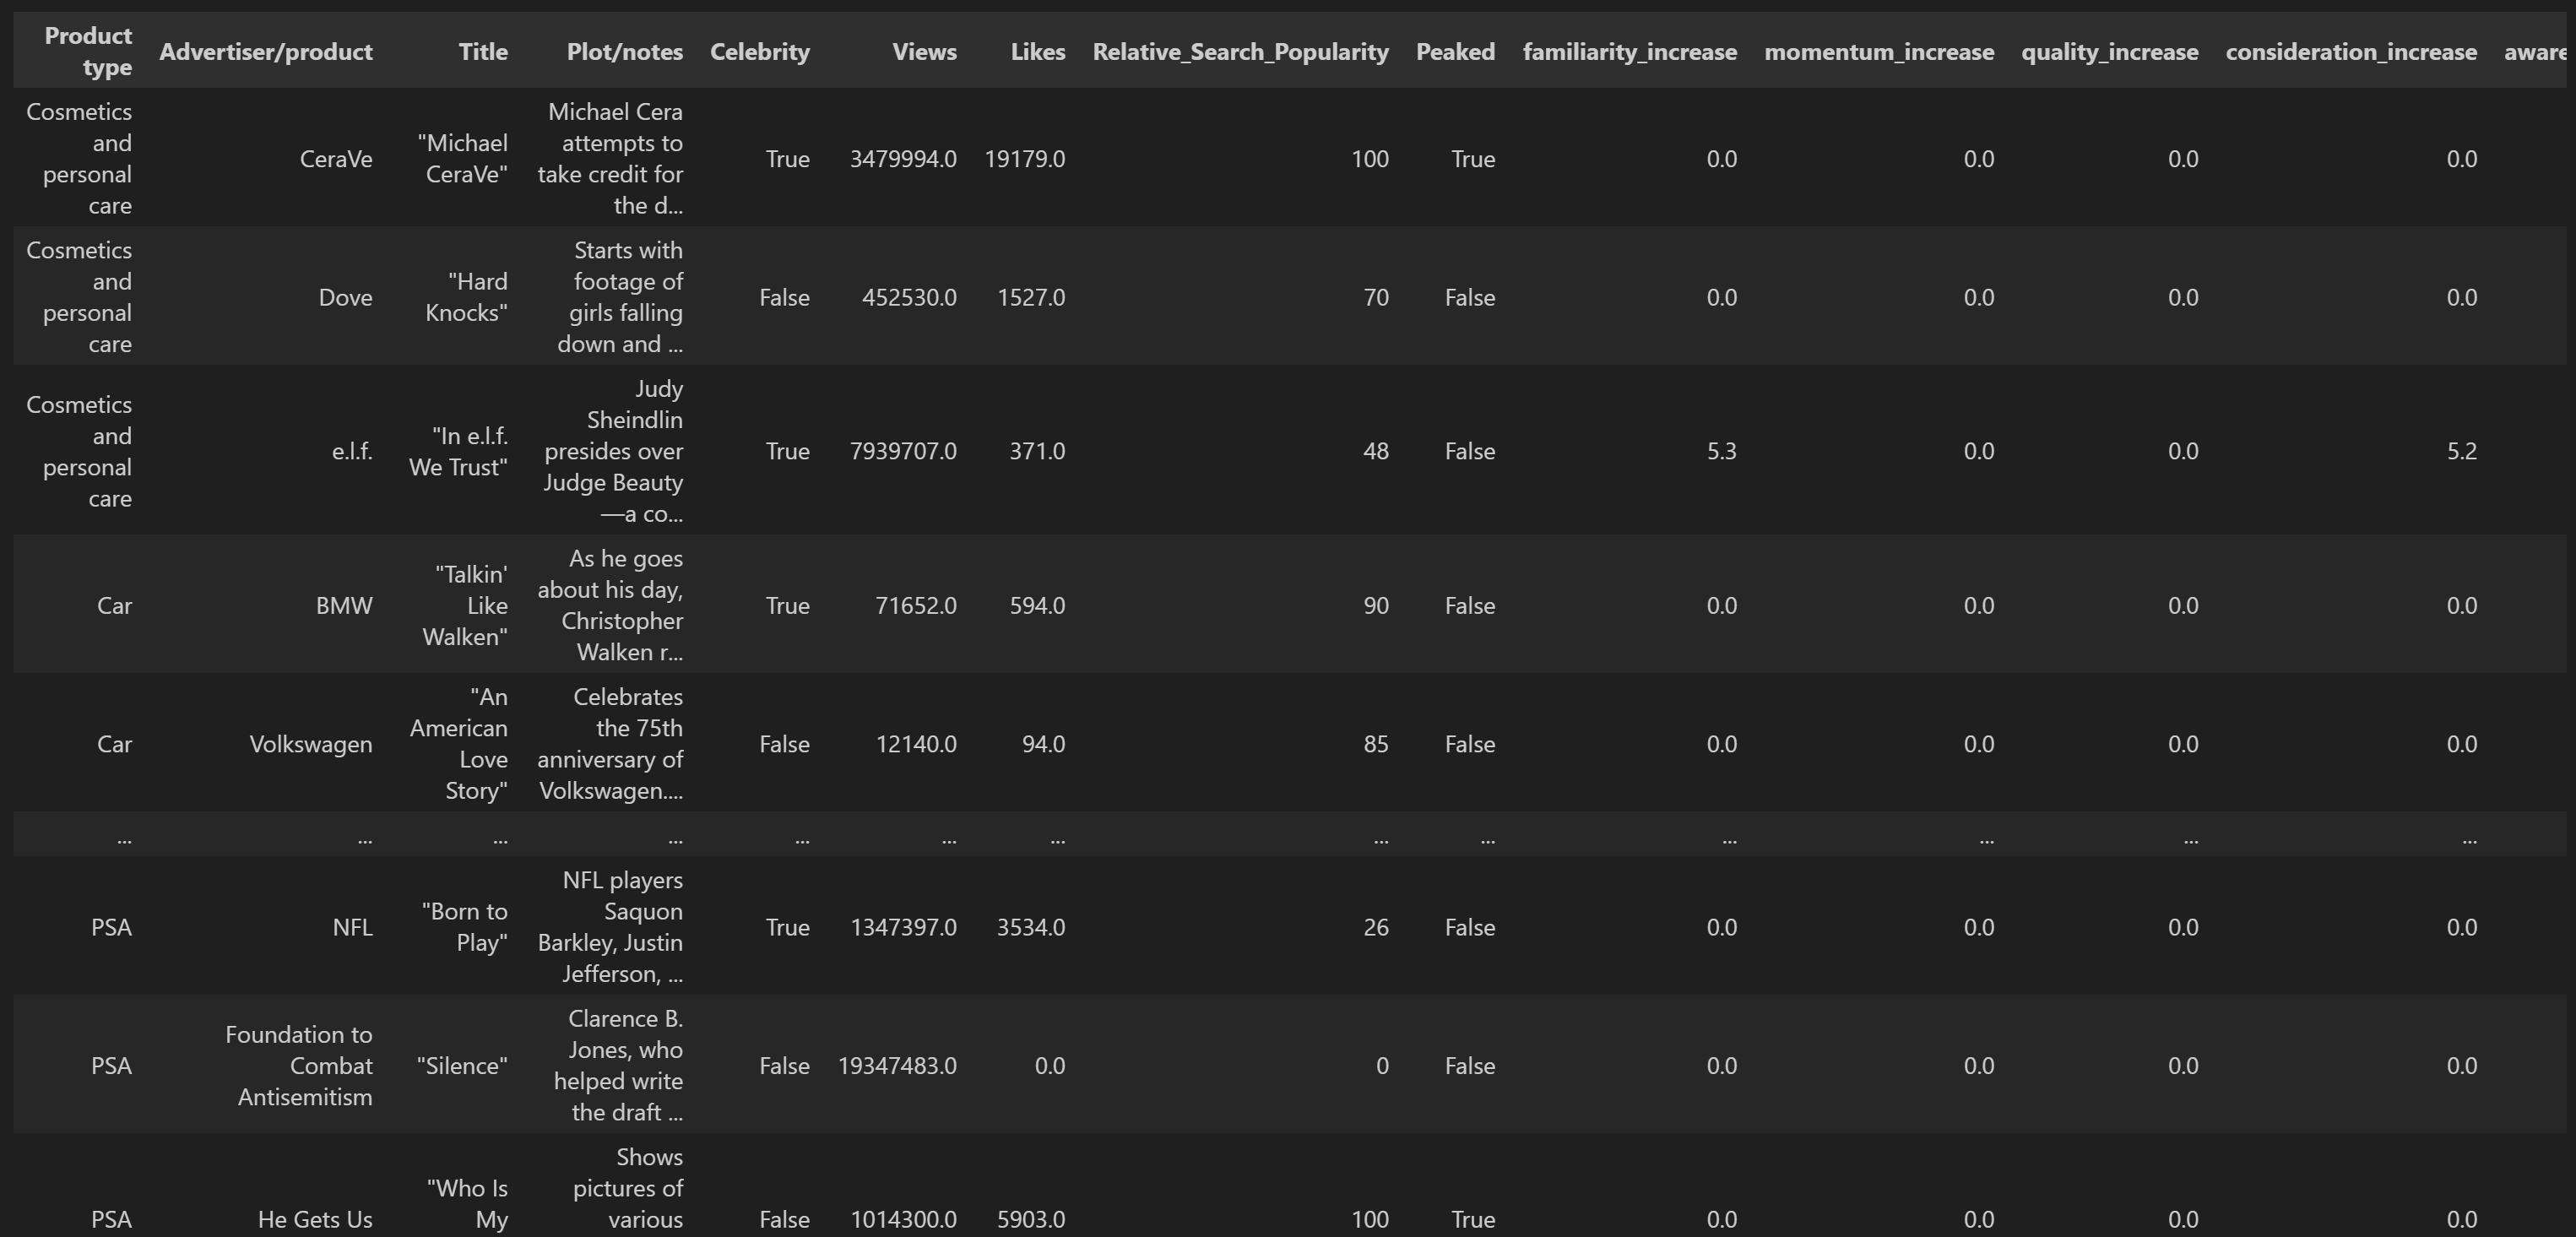
The last step was using Python to concatenate the data and curate it. Here is a screengrab of what my final dataset looks like (there are a few more polling variables that didn’t fit in the image). I can’t wait to explore it more, and start creating models that better explain the phenomena it describes. Using this data, brands could make decisions about whether to make a Super Bowl ad, whether it’s worth the price to include a celebrity in the ad, and more.
Some Initial Insights
Using Python for some quick summary statistics from my data, I answered some of these questions of interest:
- What percentage of Super Bowl 2024 ads contained celebrities? About 55.56%
- What percentage of the brands involved experienced their five-year peak in Google search popularity on the week of their Super Bowl 2024 ad? About 20.63%
- Which ads had the best like-to-view ratios on YouTube? (a common metric for good video reception)
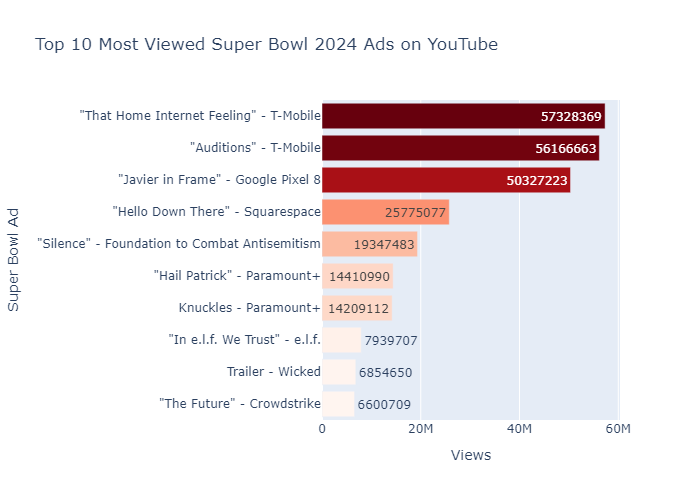
Title Advertiser/product ratio 1 "Can't B Broken" Verizon 0.025675 2 Trailer Wicked 0.019856 3 "American Values" American Values 2024 0.017728 4 Knuckles Paramount+ 0.016267 5 "Having a Blast" Mountain Dew Baja Blast 0.012832 6 "Love Triangle" Starry 0.009895 7 "Worth Remembering" Uber Eats 0.008362 8 "Talkin' Like Walken" BMW 0.008290 9 Here's to Science Pfizer 0.008192 10 "An American Love Story" Volkswagen 0.007743 - What are the top 10 most viewed Super Bowl 2024 ads on YouTube?
I am already uncovering some great insights so far, and I am looking forward to creating models and visualizations with the data I’ve gathered, cleaned, and curated.
Link to Code
All of the code and data I’ve used for this project so far can be found in this GitHub repo. Feel free to check it out!
Conclusion
Brands spent an estimated $650 million on Super Bowl ads in 2024. As data-driven marketers, it is vital to know whether spend like this is truly worth it. Using the data I’ve gathered, and statistical analysis, I will be able to better understand the answer to the question how did Super Bowl 2024 ads affect short-term brand reach and influence?
What did you think about my methods? Is there a simpler way to implement some of the techniques I used here? Is there another source of data that could be helpful to answer my question of interest? Let me know! As always, I’d love to connect through LinkedIn.